Analysis and Reporting Manager
Automatically import data into your PC
SKF’s Analysis and Reporting Manager (ARM) is a PC-based support application for the SKF Microlog. It provides automatic transfer, display and analysis of measurement data generated by the application modules running in the SKF Microlog AX and GX Series instruments.
With ARM, data is stored in a native file format. This format embeds all of the original module data as well as user inputs such as cursors, display options, notes and annotations. Data is easily transferred to a variety of other file formats (including Microsoft Excel, PDF and UFF Type 58 files) for modal analysis work.
Analysis and Reporting Manager’s post-processing features allow users to get the most out of the SKF Microlog Modules. Time domain data may be processed using Fast Fourier Transform (FFT) routines. This includes spectra and order-normalized waterfall plots or spectrograms. Spectral data may be transformed into Cepstrum or Power Spectrum. Time series data may also be processed using SKF’s envelope analysis technology to provide gE data for rolling element bearing analysis.
Support is provided for the following modules:
Analyzer
Balancing
Bump Test
Recorder
Frequency Response Function (FRF)
Run up Coast down (RuCd)
Check to Conformance
Key features
Powerful graphical displays with advanced analysis features
Digital Signal Processing (DSP) including envelope analysis
Management and editing of Conformance Check set up files in the SKF Microlog
Conformance Check results combined to generate trend plots
Export of data to UFF (Type 58) files, allowing easy import into structural analysis applications
Batch export of data Microsoft Excel, allowing consolidation of multiple measurements into a single workbook with multiple tabs or separate workbooks
Creation of Microsoft Word documents from data
Custom balancing reports created in Microsoft Word
Export of measurements to PDF, HTML or ASCII file
Transfer of measurement data to and from SKF @ptitude Analyst with the add-on version (included with CMSW 7300 and CMSW 7400 licences)
Analysis and Reporting Manager plots
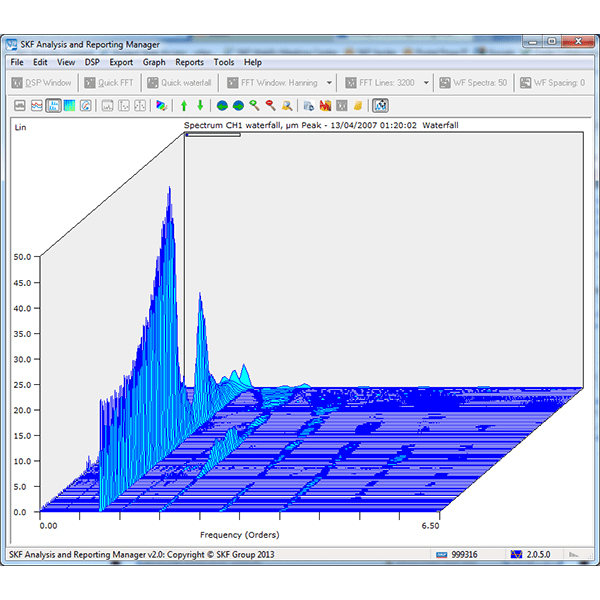
Order normalized Waterfall plot (fig 1)
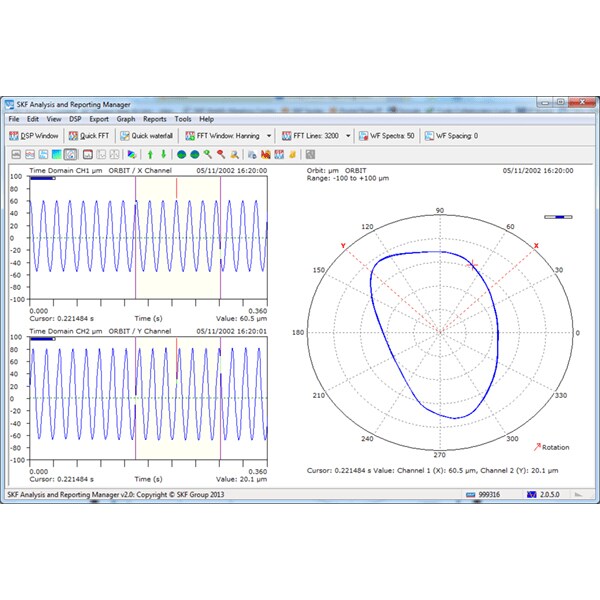
Orbit plot (fig 2)
Transfer function – Frequency Response Function (FRF) plot (fig 3)
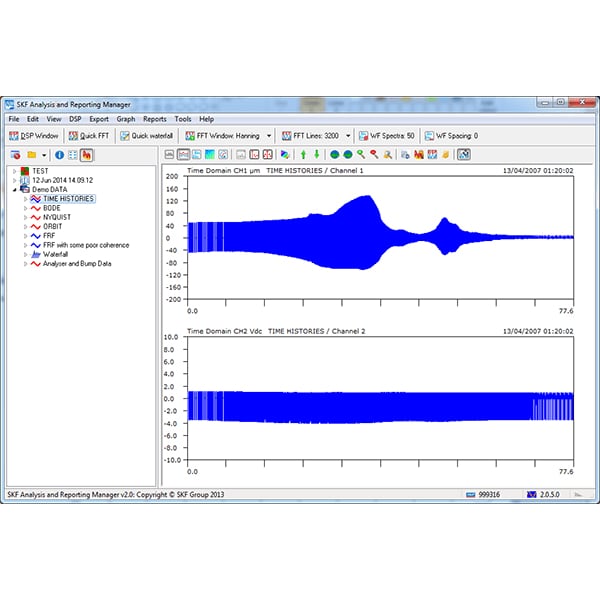
Time domain plot (fig 4)
![]()